Part 16 Example geoms and Plots
16.1 Bar chart
theme_set(theme_classic())

ggplot(penguins) +
  aes(x = species) +
  geom_bar()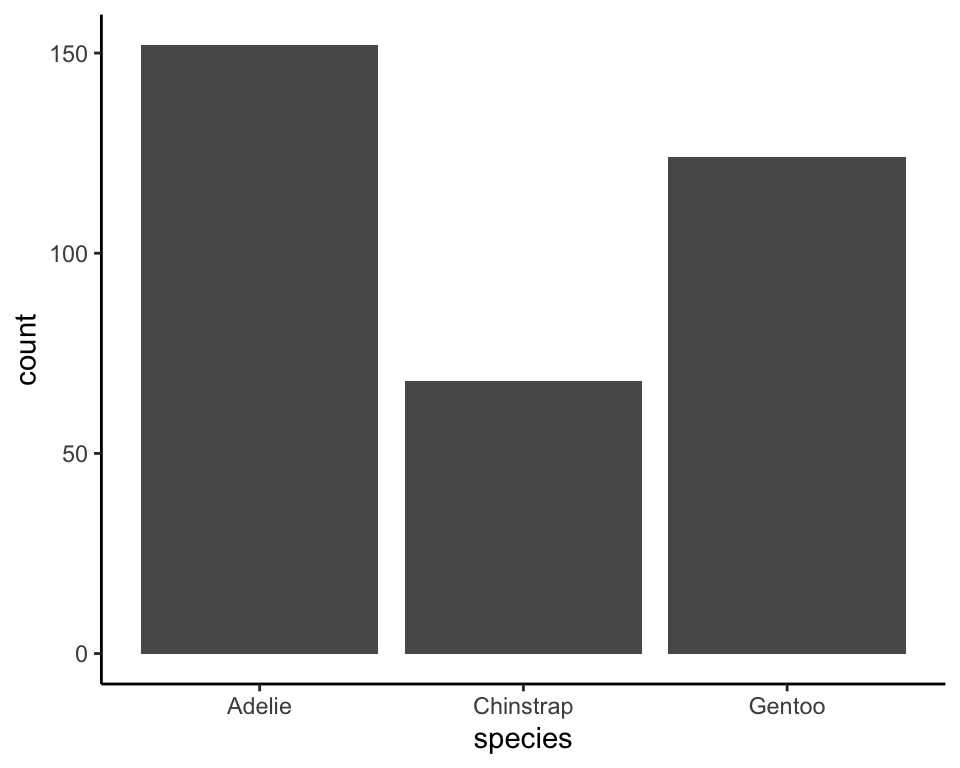
16.2 Stacked bar chart
ggplot(penguins) +
  aes(y = island,
      color = fct_rev(species),
      fill = fct_rev(species),
      label = fct_rev(species)) +
  stat_count(orientation = "y") +
  guides(color = guide_none(),
         fill = guide_none()) +
  ylab(NULL) +
  stat_count(geom = "label",
             color = "white")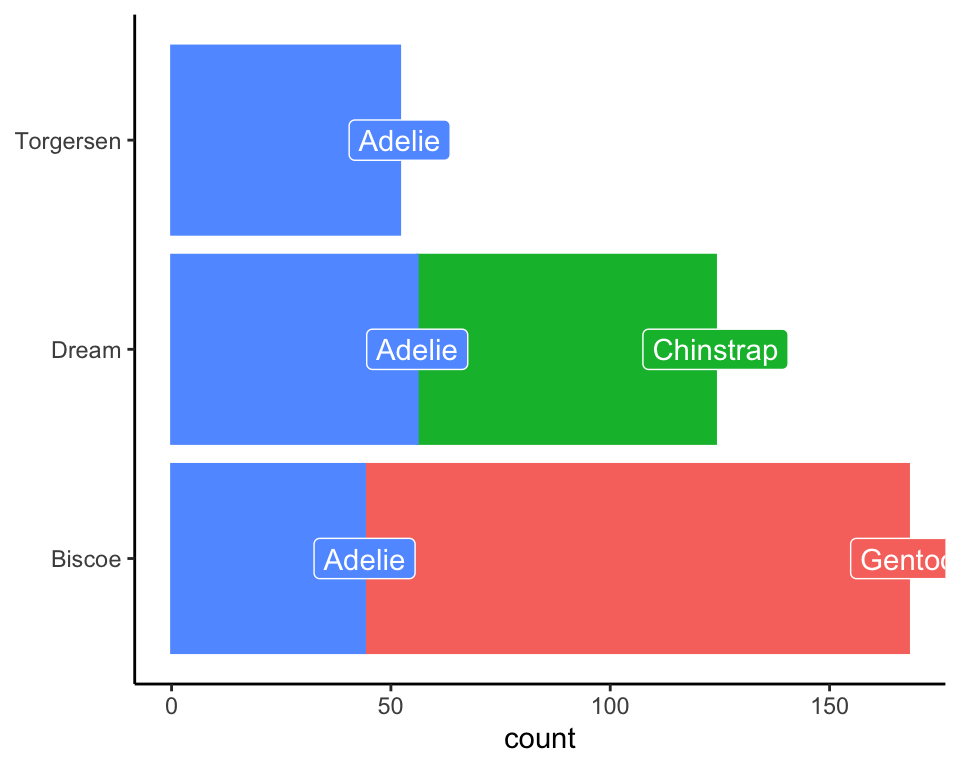
16.3 Pie chart
ggplot(penguins) +
  aes(x = factor(1),
      fill = species,
      label = species) +
  geom_bar(width = 1) +
  stat_count(geom = "text",
             size = 5,
             color = "white",
             position = position_stack(vjust = .5)
  ) +
  guides(y = guide_none(),
         x = guide_none(),
         fill = guide_none()) +
  xlab(NULL) +
  ylab(NULL) +
  coord_polar(theta = "y") +
  theme(axis.text = element_blank(),
        axis.line = element_blank(),
        axis.ticks = element_blank())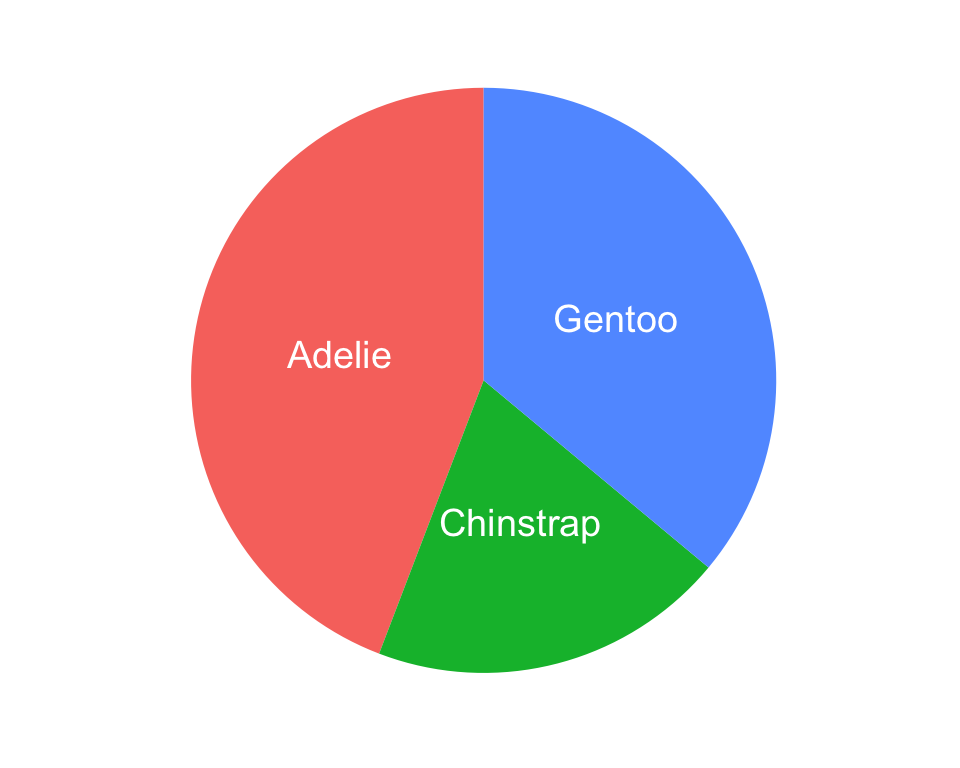
16.4 Histogram
ggplot(penguins) +
  aes(x = bill_length_mm) +
  geom_histogram(binwidth = 1)
#> Warning: Removed 2 rows containing non-finite values (stat_bin).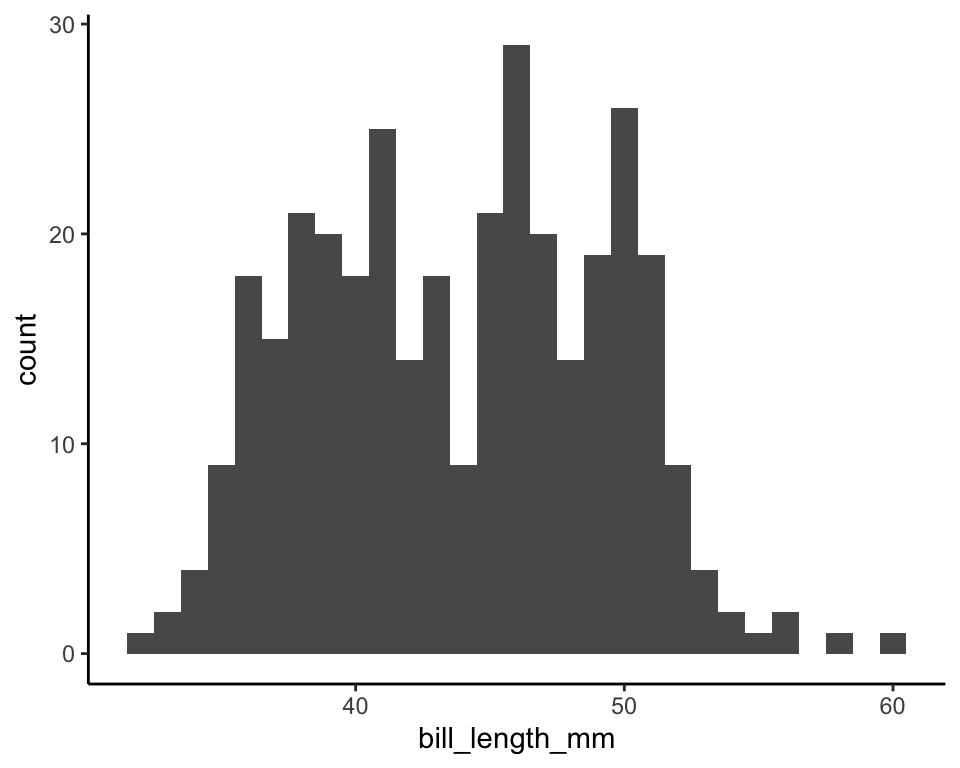
16.5 Density
ggplot(penguins) +
  aes(x = bill_length_mm) +
  geom_density()
#> Warning: Removed 2 rows containing non-finite values (stat_density).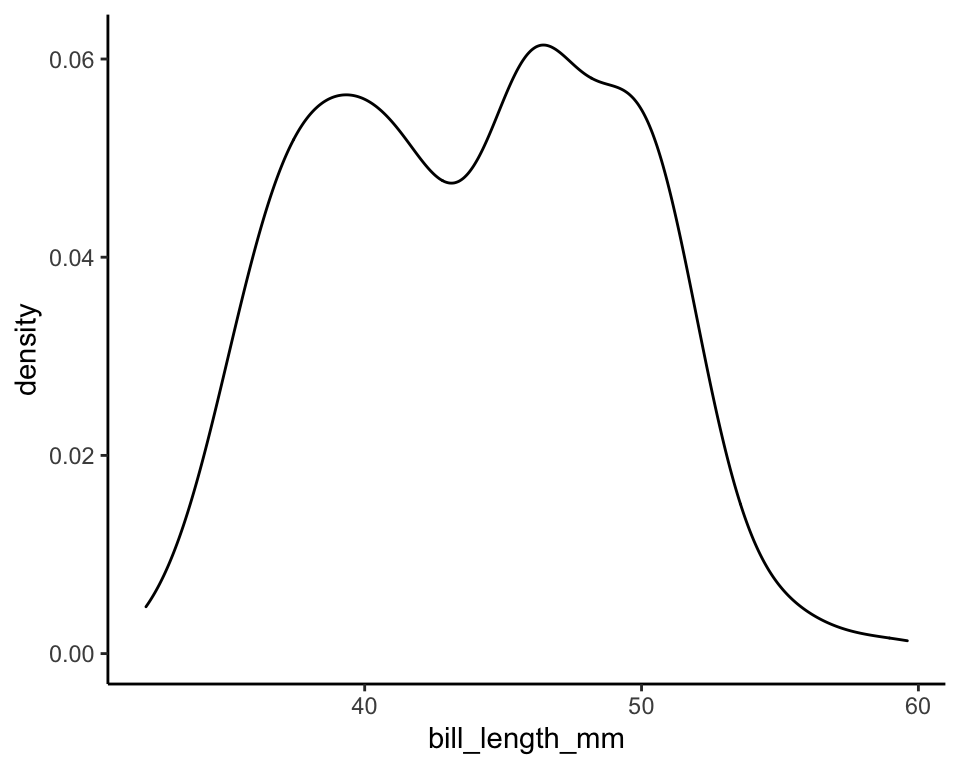
16.6 Dot plot
ggplot(penguins) +
  aes(x = bill_length_mm) +
  geom_dotplot(binwidth = 1,
               dotsize = .5) +
  guides(y = guide_none())
#> Warning: Removed 2 rows containing non-finite values (stat_bindot).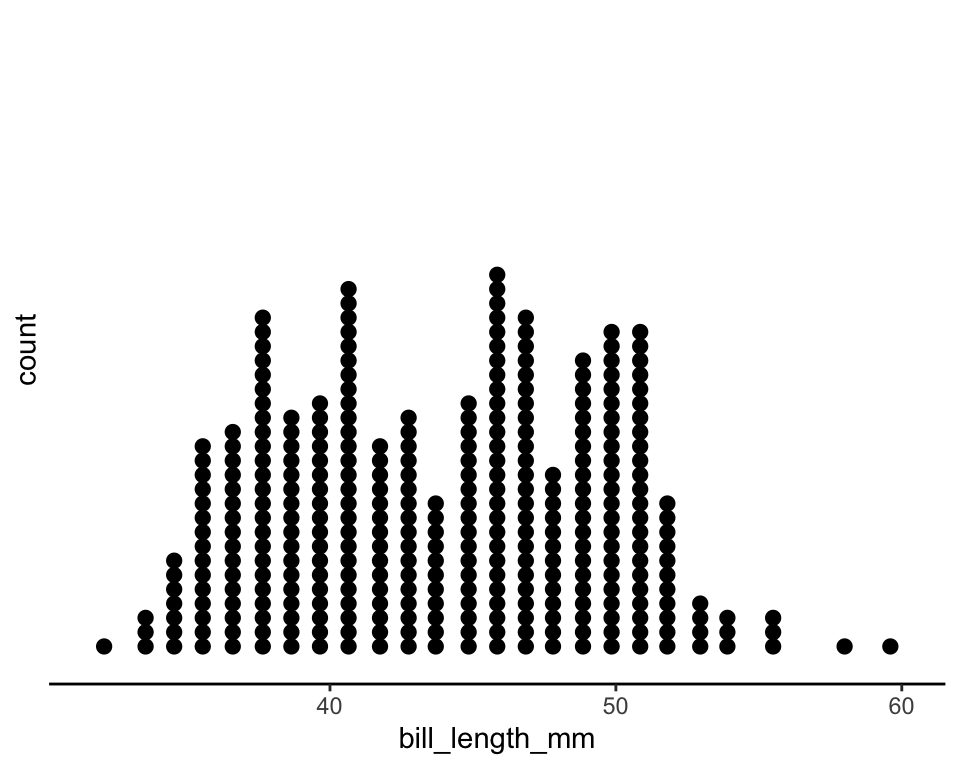
16.7 Scatterplots
# Scatterplot 1
ggplot(penguins) +
  aes(x = bill_length_mm,
      y = flipper_length_mm) +
  geom_point()
#> Warning: Removed 2 rows containing missing values (geom_point).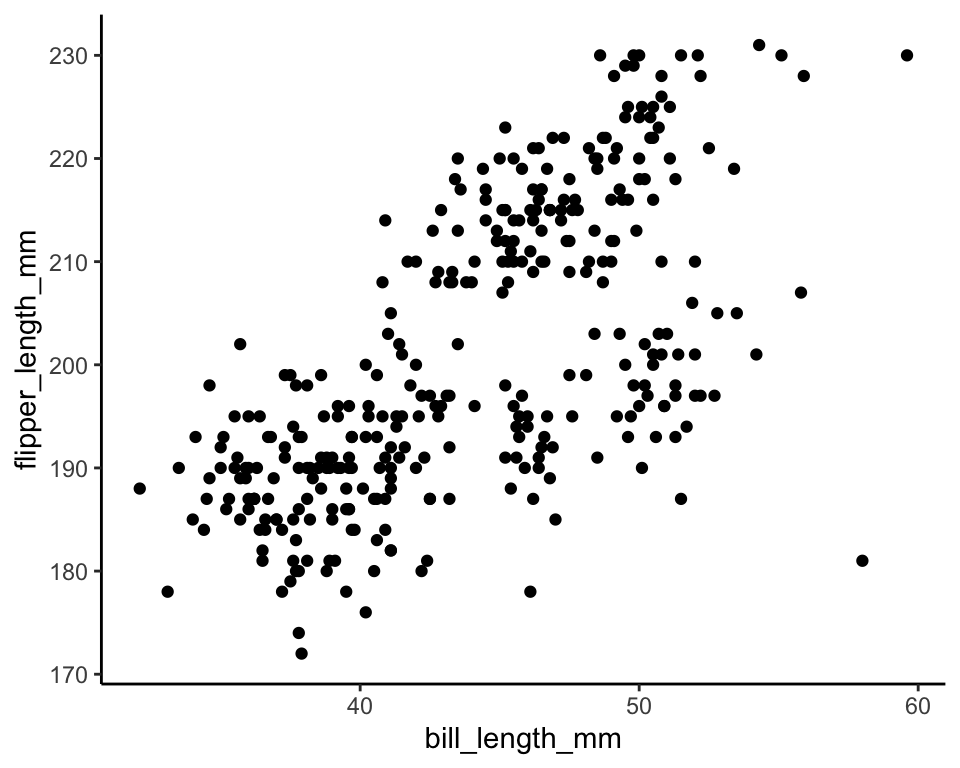
# Scatterplot 2
ggplot(penguins) +
  aes(x = bill_length_mm,
      y = flipper_length_mm,
      fill = species,
      color = species,
      shape = species) +
  geom_point()
#> Warning: Removed 2 rows containing missing values (geom_point).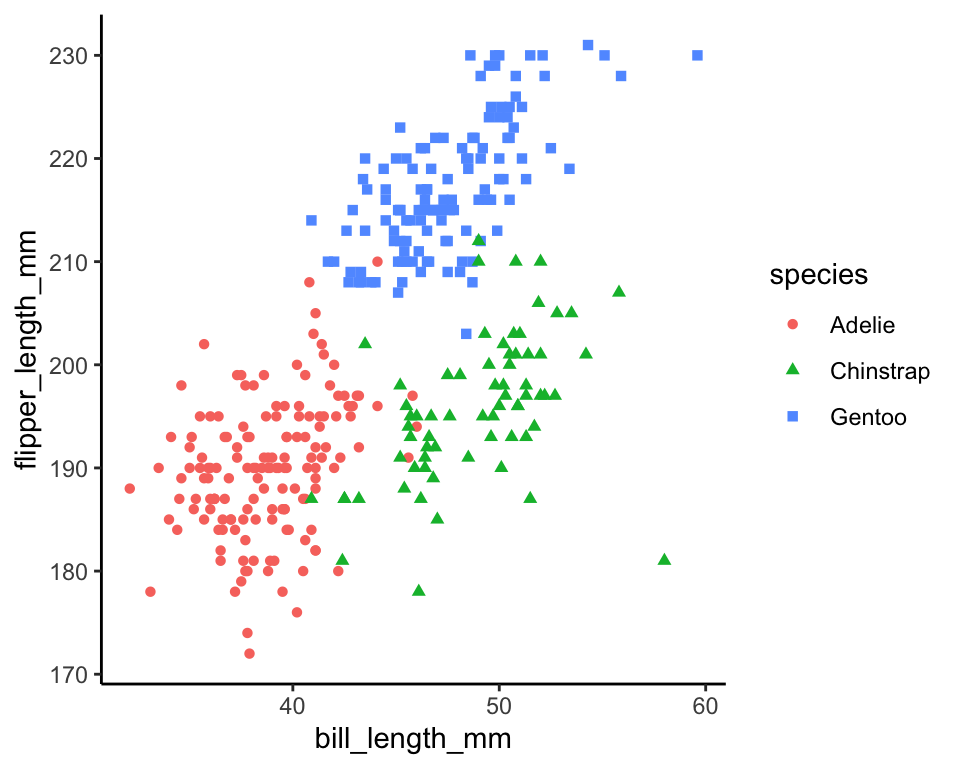
# Scatterplot 3
ggplot(penguins) +
  aes(x = bill_length_mm,
      y = flipper_length_mm,
      fill = species,
      color = species,
      shape = sex,
      size = body_mass_g) +
  geom_point()
#> Warning: Removed 11 rows containing missing values (geom_point).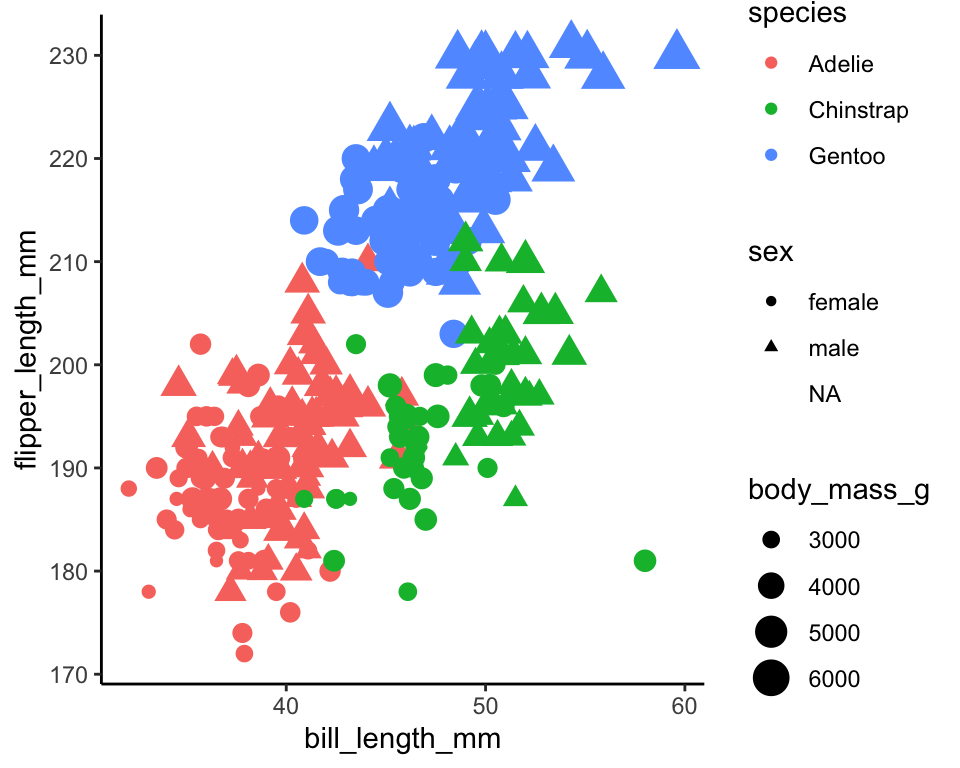
16.8 More scatterplots
# Scatterplot 4
ggplot(round(alr4::Heights)) +
  aes(x = mheight,
      y = dheight) +
  geom_point()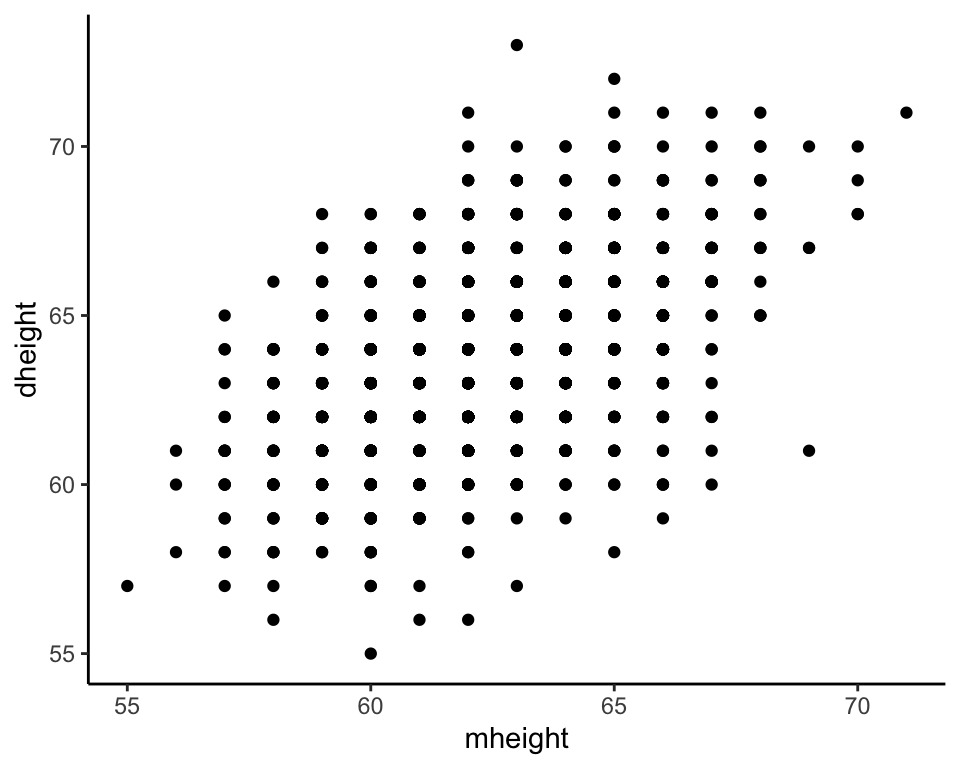
# Scatterplot 5
ggplot(round(alr4::Heights)) +
  aes(x = mheight,
      y = dheight) +
  geom_jitter(height = .3, width = .3)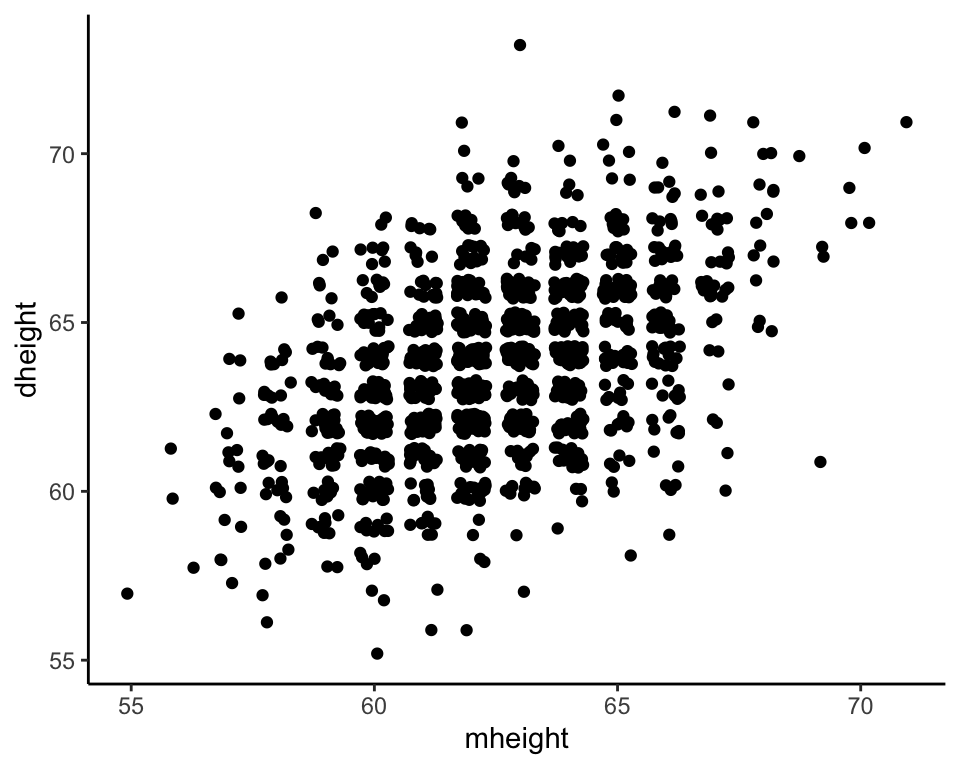
16.9 Building complex plots
# Scatterplot 6
ggplot(penguins) +
  aes(x = species,
      y = flipper_length_mm,
      fill = species,
      color = species) +
  geom_point()
#> Warning: Removed 2 rows containing missing values (geom_point).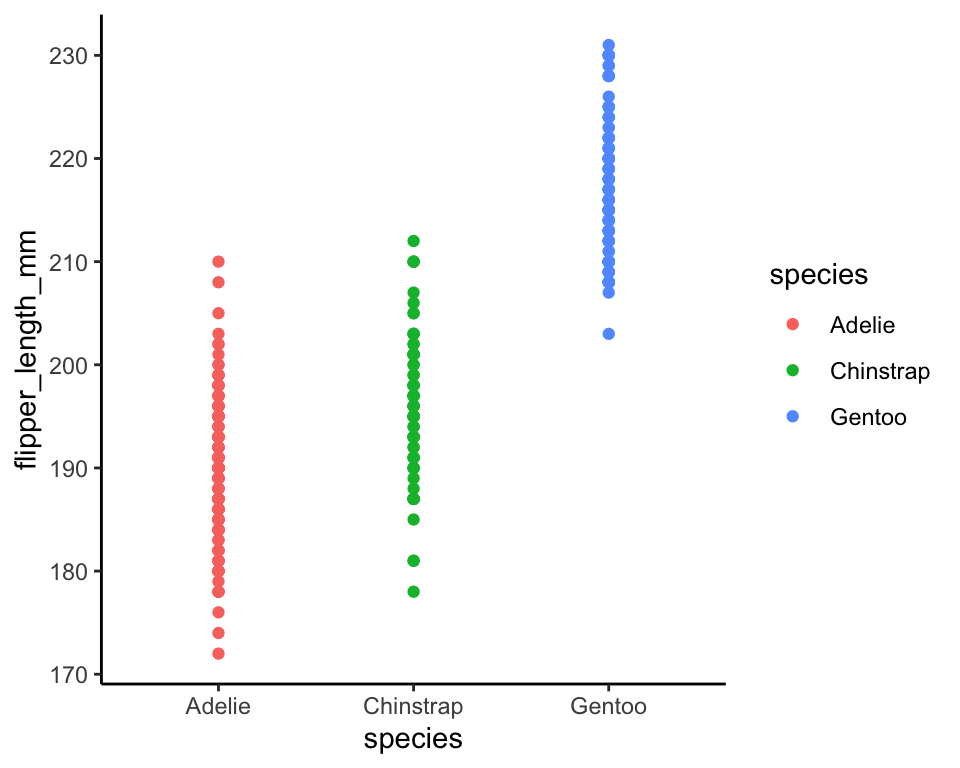
# Scatterplot 7
ggplot(penguins) +
  aes(x = species,
      y = flipper_length_mm,
      fill = species,
      color = species) +
  geom_jitter(height = 0,
              width = .4)
#> Warning: Removed 2 rows containing missing values (geom_point).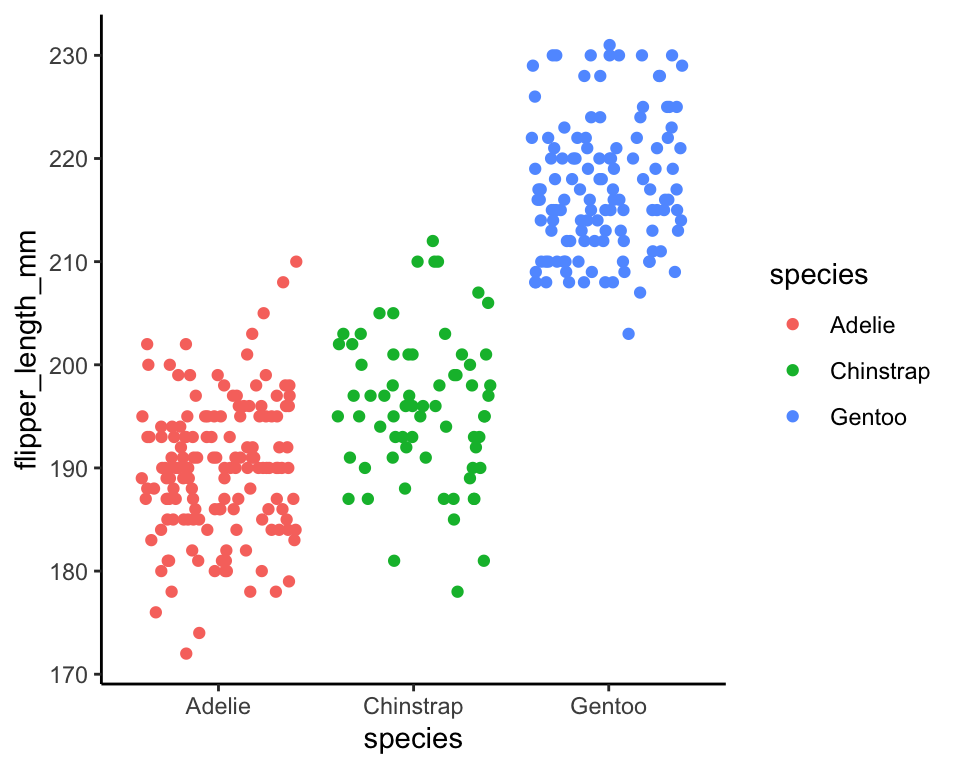
# Scatterplot 8
ggplot(penguins) +
  aes(x = species,
      y = flipper_length_mm,
      fill = species,
      color = species) +
  geom_jitter(height = 0,
              width = .4) +
  geom_boxplot(color = "black",
               alpha = .5)
#> Warning: Removed 2 rows containing non-finite values (stat_boxplot).

#> Warning: Removed 2 rows containing missing values (geom_point).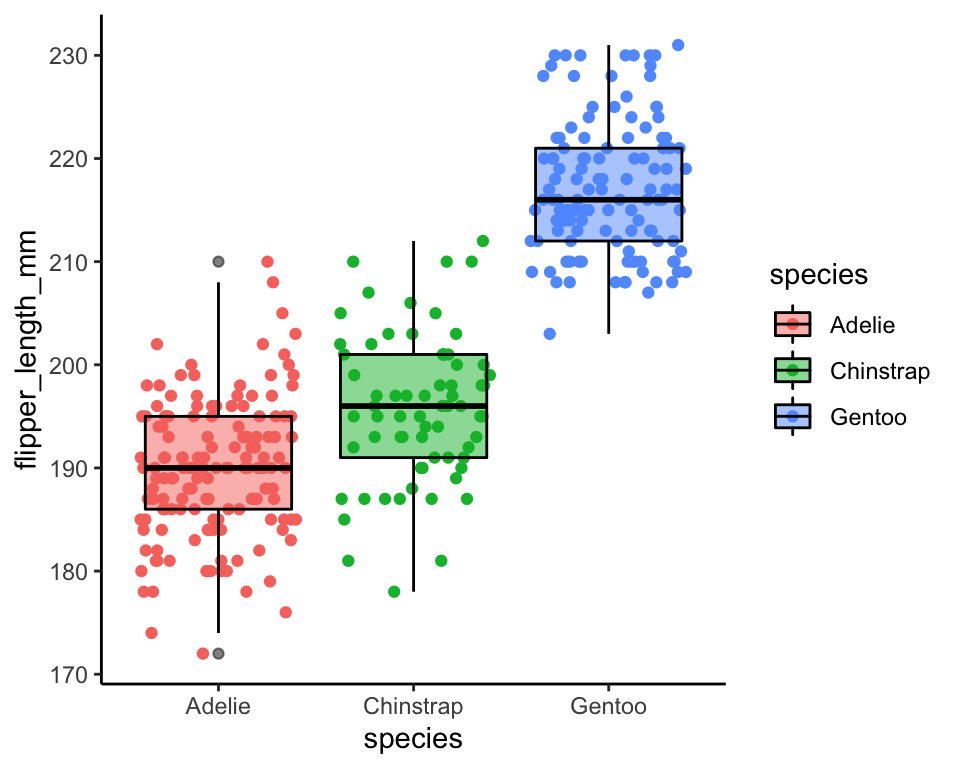
# Raincloud plot
ggplot(na.omit(penguins)) +
  aes(y = species,
      x = flipper_length_mm,
      fill = species,
      color = species) +
  geom_jitter(height = .15) +
  geom_boxplot(color = "black",
               alpha = .5,
               width = .1,
               size = .5) +
  ggdist::stat_slab(height = .3,
                    color = "black",
                    size = .2,
                    alpha = .5,
                    position = position_nudge(y = .2))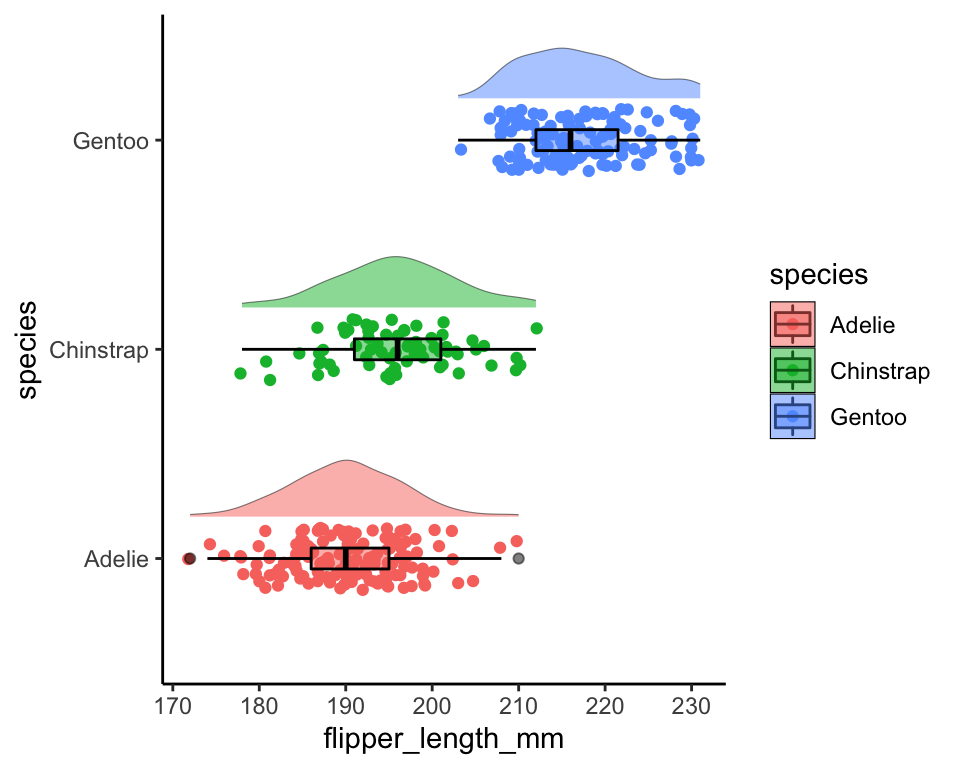
16.10 Scatterplots for change
df <- data.frame(
  id = 1:30,
  before = rnorm(30),
  after = rnorm(30))
df <- tidyr::pivot_longer(
  df,
  -id,
  names_to = "time",
  values_to = "score")
ggplot(df) +
  aes(x = time,
      y = score,
      group = id) +
  geom_point() +
  geom_line()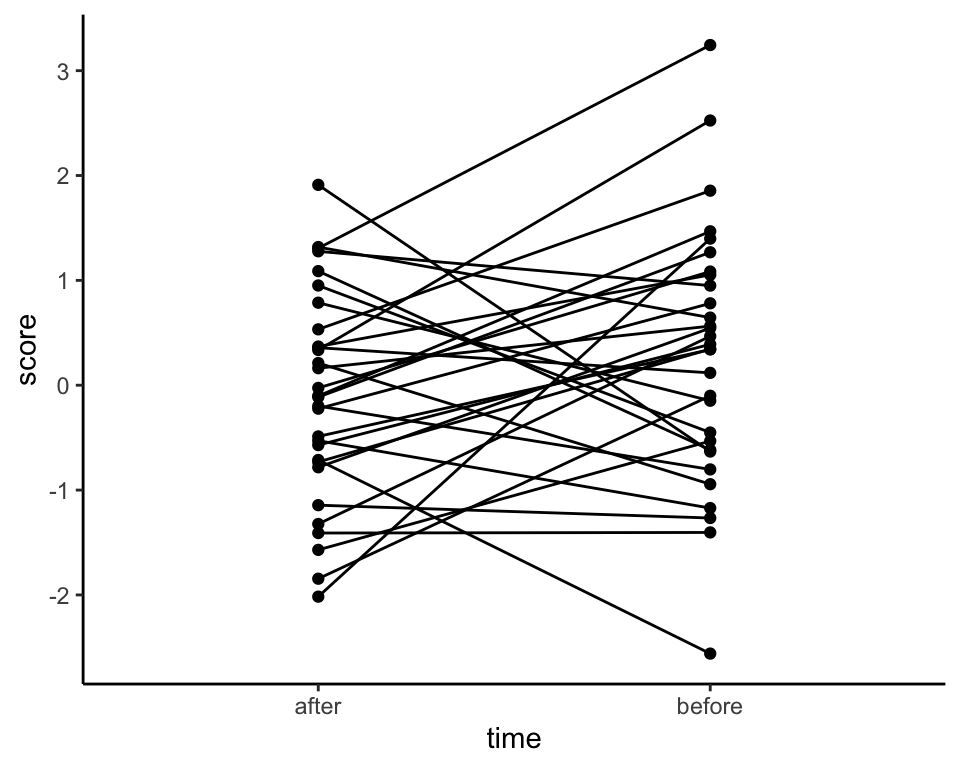
16.11 Comparing distributions
df <- data.frame(
  g = c(rep("a", times = 100),
        rep("b", times = 100),
        rep("c", times = 100),
        rep("d", times = 100),
        rep("e", times = 100)),
  z = c(rnorm(100, mean = 0, sd = 1),
        rnorm(100, mean = 1, sd = 2),
        rnorm(100, mean = 2, sd = 3),
        rnorm(100, mean = 3, sd = 4),
        rnorm(100, mean = 4, sd = 5))
)

# Overlapping densities
ggplot(df) +
  aes(x = z,
      group = g,
      fill = g) +
  geom_density(size = .2,
               alpha = .5)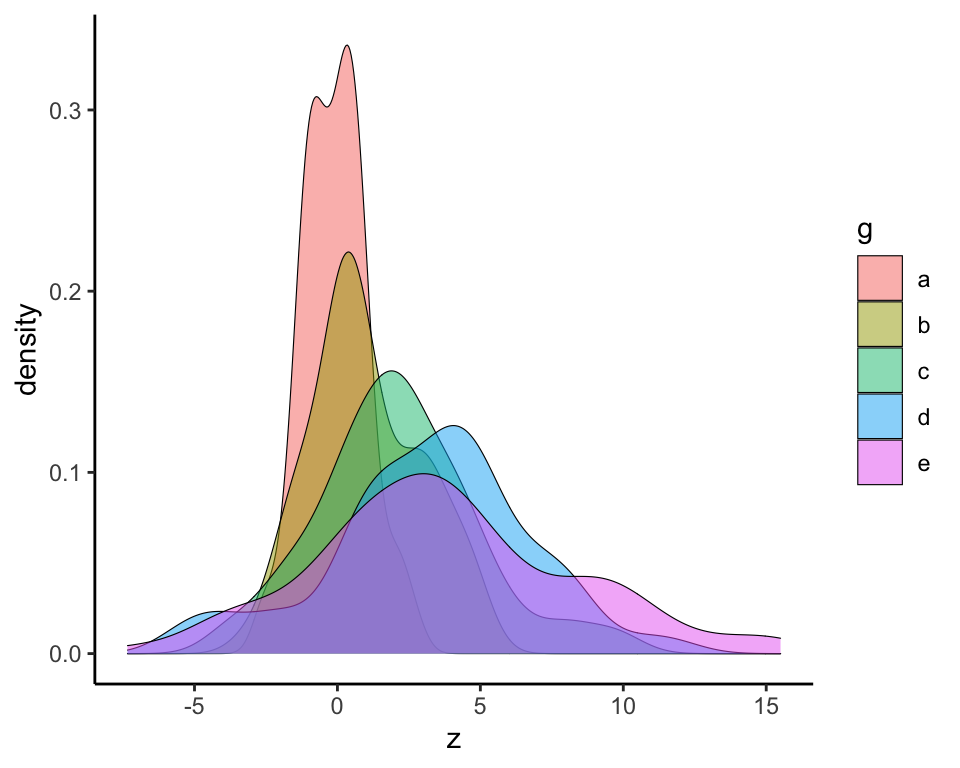
# Ridge plot
ggplot(df) +
  aes(x = z,
      y = g,
      fill = g) +
  ggridges::geom_density_ridges(
    size = .2,
    alpha = .5,
    scale = 4
  )
#> Picking joint bandwidth of 0.88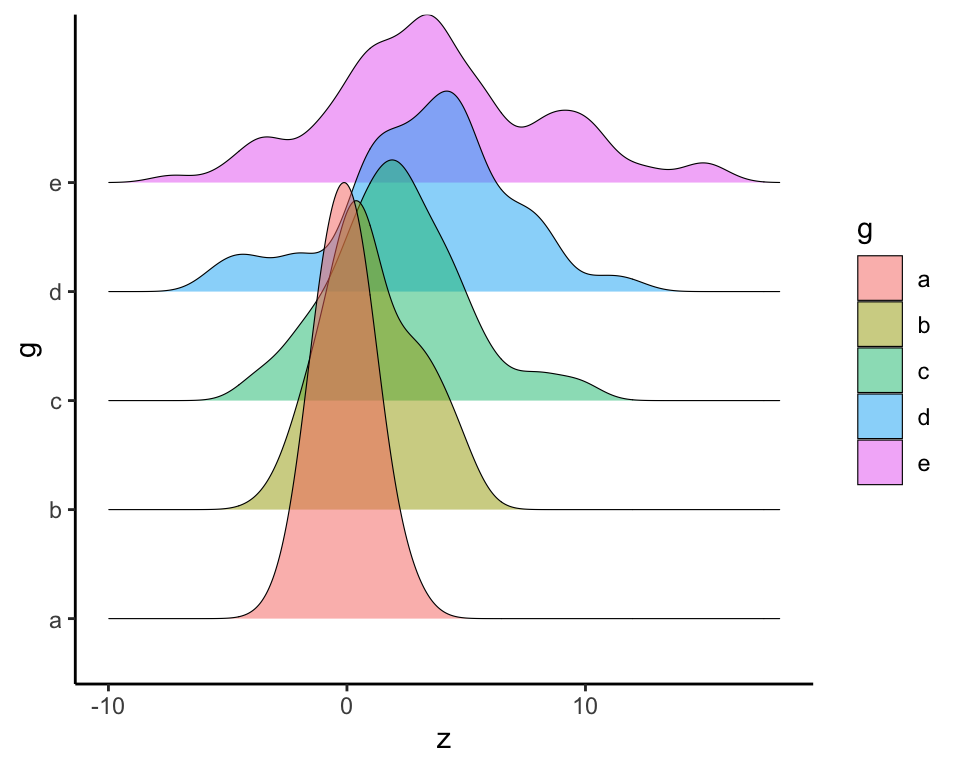
16.12 Scatterplot matrix
penguins_focal <- penguins[, c("species",
                               "bill_length_mm",
                               "flipper_length_mm",
                               "sex")]
pairs(penguins_focal)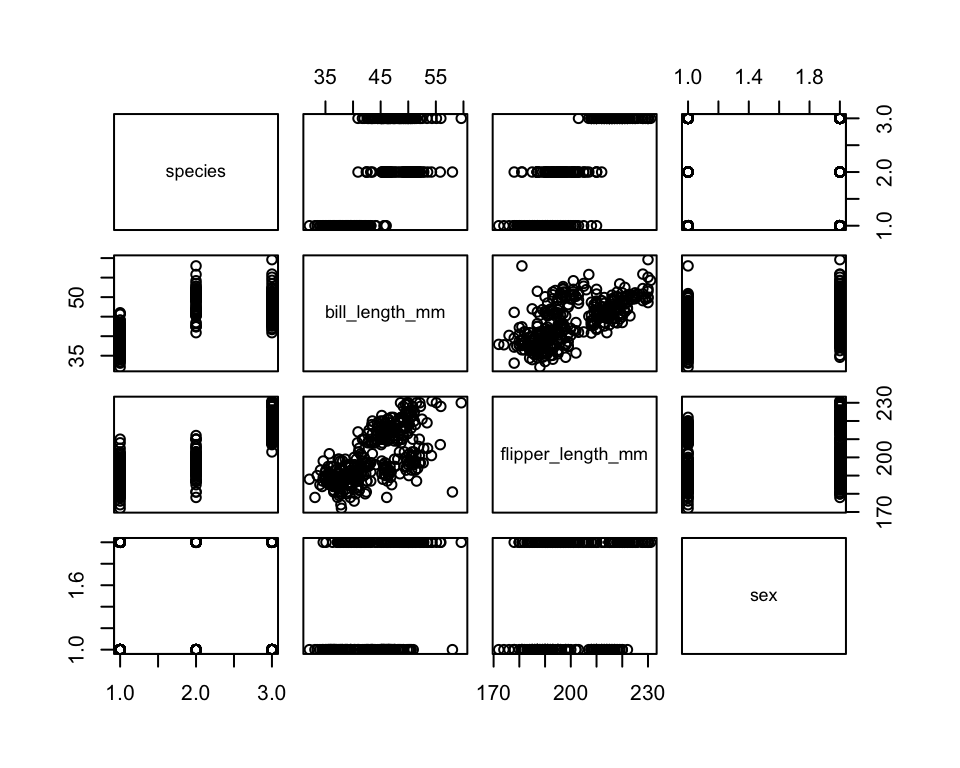
GGally::ggpairs(
  penguins_focal,
  mapping = aes(color = species, alpha = .5),
  lower = list(
    continuous = "smooth_loess",
    combo = "facethist",
    discrete = "facetbar",
    na = "na"
  )
) + theme_classic()
#> Registered S3 method overwritten by 'GGally':
#>   method from
#>   +.gg   ggplot2
#> Warning: Removed 2 rows containing non-finite values (stat_boxplot).

#> Warning: Removed 2 rows containing non-finite values (stat_boxplot).
#> `stat_bin()` using `bins = 30`. Pick better value with `binwidth`.
#> Warning: Removed 2 rows containing non-finite values (stat_bin).
#> Warning: Removed 2 rows containing non-finite values (stat_density).
#> Warning in ggally_statistic(data = data, mapping = mapping, na.rm = na.rm, :
#> Removed 2 rows containing missing values
#> Warning: Removed 2 rows containing non-finite values (stat_boxplot).
#> `stat_bin()` using `bins = 30`. Pick better value with `binwidth`.
#> Warning: Removed 2 rows containing non-finite values (stat_bin).
#> Warning: Removed 2 rows containing non-finite values (stat_smooth).
#> Warning: Removed 2 rows containing missing values (geom_point).
#> Warning: Removed 2 rows containing non-finite values (stat_density).
#> Warning: Removed 2 rows containing non-finite values (stat_boxplot).
#> `stat_bin()` using `bins = 30`. Pick better value with `binwidth`.
#> Warning: Removed 2 rows containing non-finite values (stat_bin).
#> `stat_bin()` using `bins = 30`. Pick better value with `binwidth`.
#> Warning: Removed 2 rows containing non-finite values (stat_bin).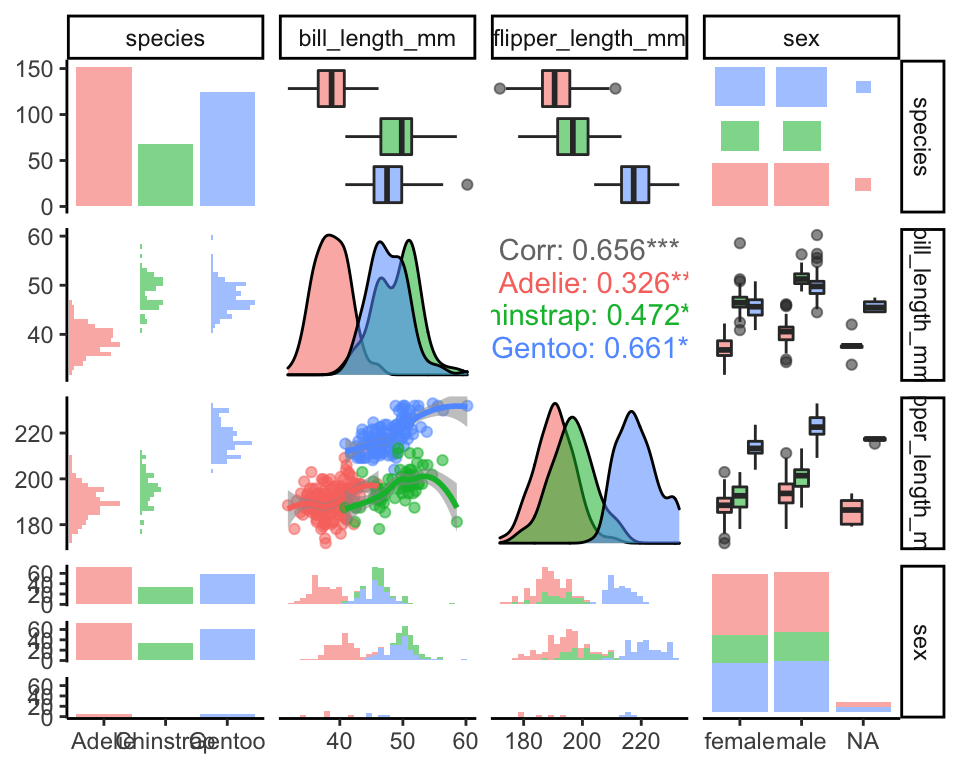
16.13 Smoothers and Exploratory Data Analysis
# Smoother 1
ggplot(penguins) +
  aes(x = bill_length_mm,
      y = flipper_length_mm,
      fill = species,
      color = species) +
  geom_point() +
  geom_smooth(color = "black",
              fill = "black")
#> `geom_smooth()` using method = 'loess' and formula 'y ~ x'
#> Warning: Removed 2 rows containing non-finite values (stat_smooth).
#> Warning: Removed 2 rows containing missing values (geom_point).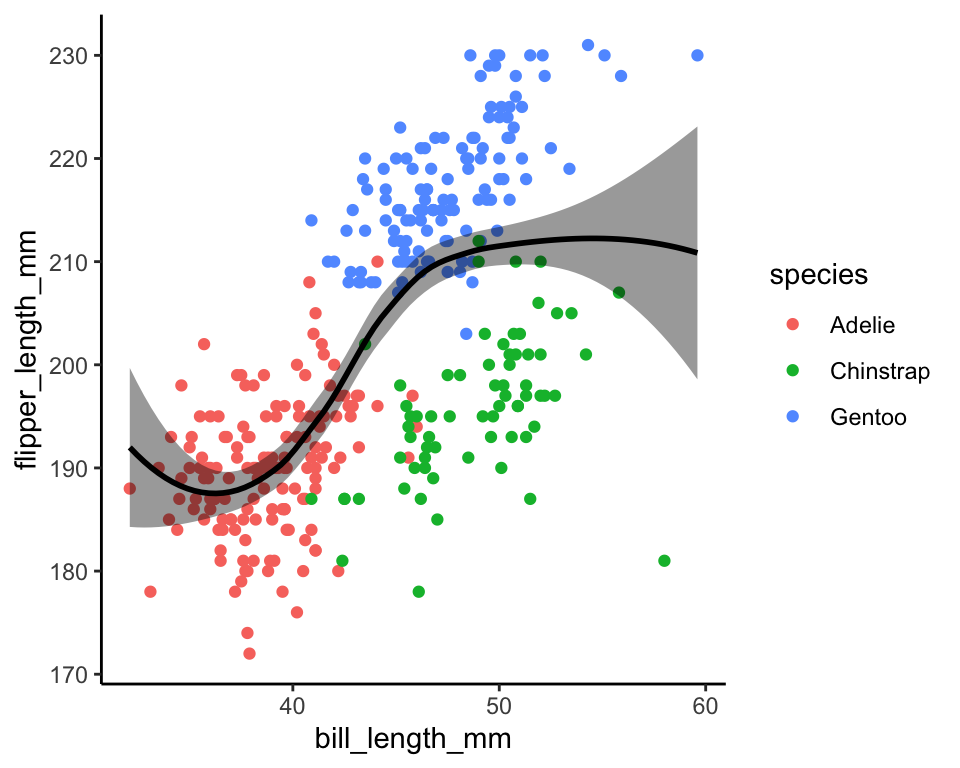
# Smoother 2
ggplot(penguins) +
  aes(x = bill_length_mm,
      y = flipper_length_mm,
      fill = species,
      color = species) +
  geom_point() +
  geom_smooth(color = "black",
              fill = "black") +
  geom_smooth(method = "lm",
              color = "orange",
              fill = "orange")
#> `geom_smooth()` using method = 'loess' and formula 'y ~ x'
#> Warning: Removed 2 rows containing non-finite values (stat_smooth).
#> `geom_smooth()` using formula 'y ~ x'
#> Warning: Removed 2 rows containing non-finite values (stat_smooth).

#> Warning: Removed 2 rows containing missing values (geom_point).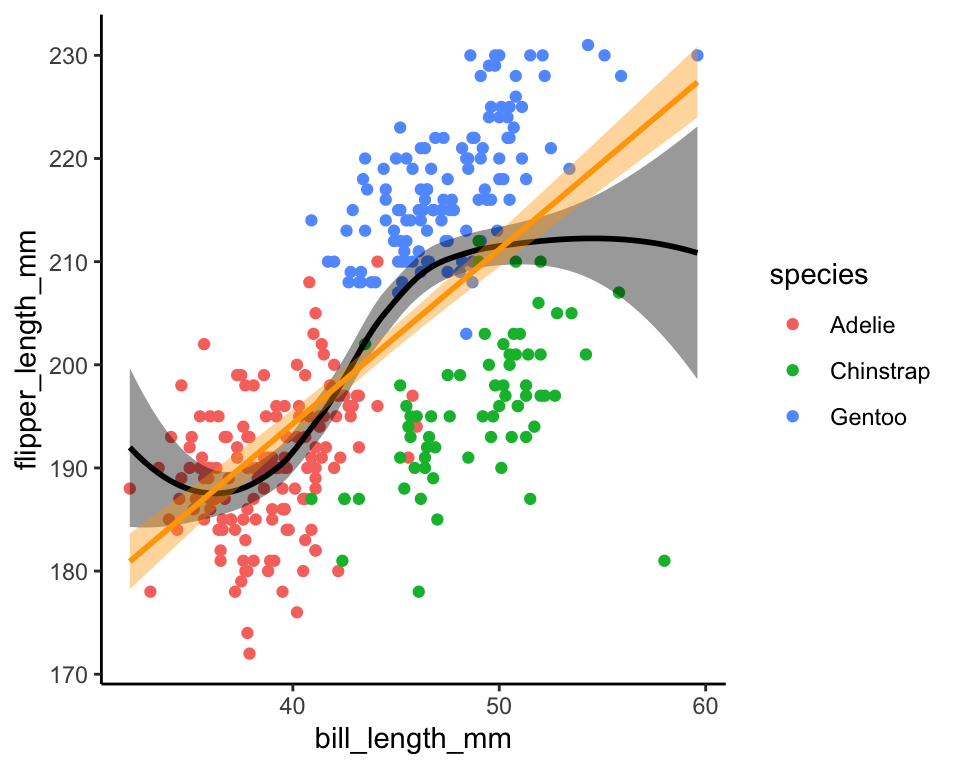
# Smoother 3
ggplot(penguins) +
  aes(x = bill_length_mm,
      y = flipper_length_mm,
      fill = species,
      color = species) +
  geom_point() +
  geom_smooth()
#> `geom_smooth()` using method = 'loess' and formula 'y ~ x'
#> Warning: Removed 2 rows containing non-finite values (stat_smooth).

#> Warning: Removed 2 rows containing missing values (geom_point).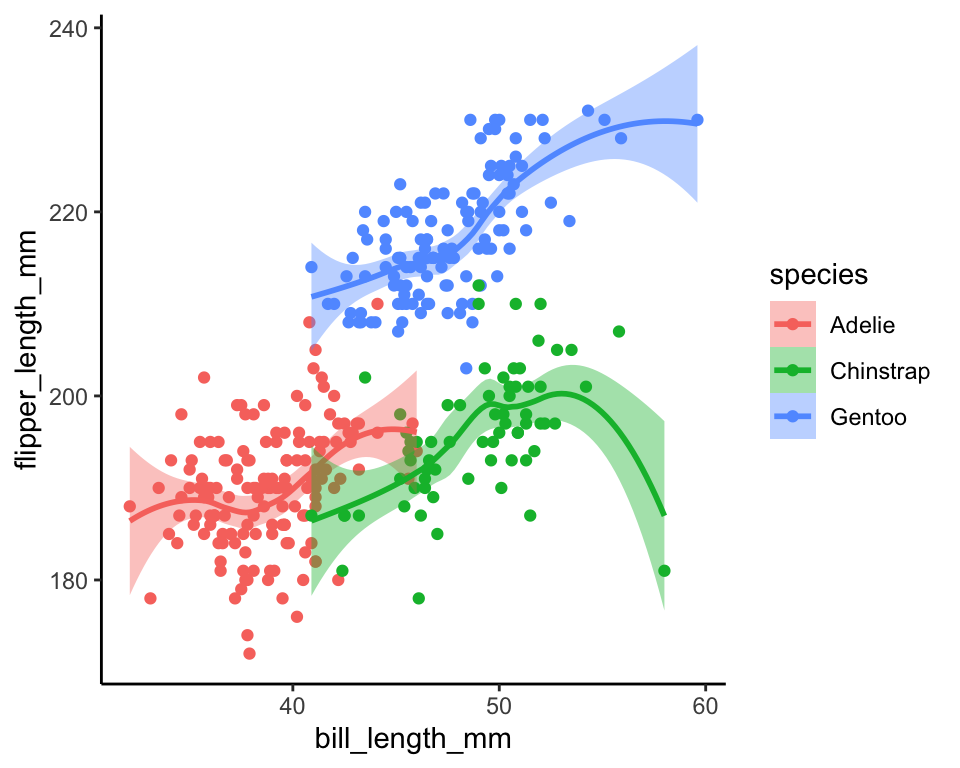
# Smoother 4
ggplot(penguins) +
  aes(x = bill_length_mm,
      y = flipper_length_mm,
      fill = species,
      color = species) +
  geom_point() +
  geom_smooth() +
  geom_smooth(method = "lm",
              color = "black",
              linetype = "dashed")
#> `geom_smooth()` using method = 'loess' and formula 'y ~ x'
#> Warning: Removed 2 rows containing non-finite values (stat_smooth).
#> `geom_smooth()` using formula 'y ~ x'
#> Warning: Removed 2 rows containing non-finite values (stat_smooth).

#> Warning: Removed 2 rows containing missing values (geom_point).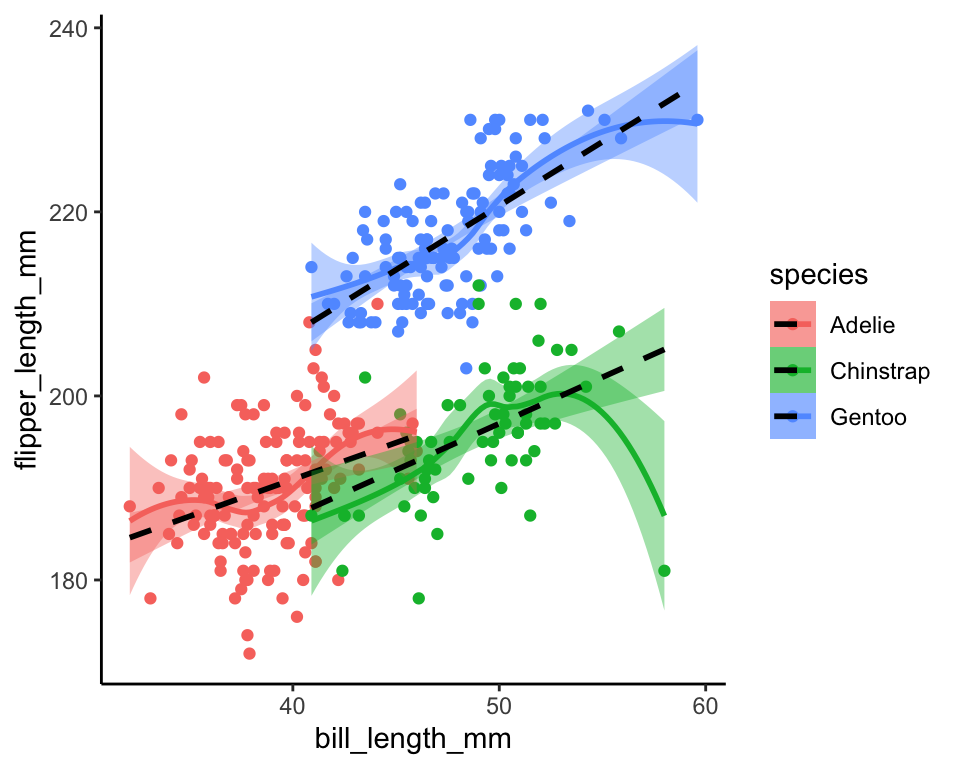
# Smoother 5
ggplot(penguins) +
  aes(x = bill_length_mm,
      y = flipper_length_mm,
      fill = species,
      color = species) +
  geom_point() +
  geom_smooth(method = "lm",
              linetype = "dashed") +
  geom_smooth(color = "black",
              fill = "black",
              alpha = .2) +
  geom_smooth(method = "lm",
              color = "orange",
              fill = "orange",
              alpha = .2)
#> `geom_smooth()` using formula 'y ~ x'
#> Warning: Removed 2 rows containing non-finite values (stat_smooth).
#> `geom_smooth()` using method = 'loess' and formula 'y ~ x'
#> Warning: Removed 2 rows containing non-finite values (stat_smooth).
#> `geom_smooth()` using formula 'y ~ x'
#> Warning: Removed 2 rows containing non-finite values (stat_smooth).

#> Warning: Removed 2 rows containing missing values (geom_point).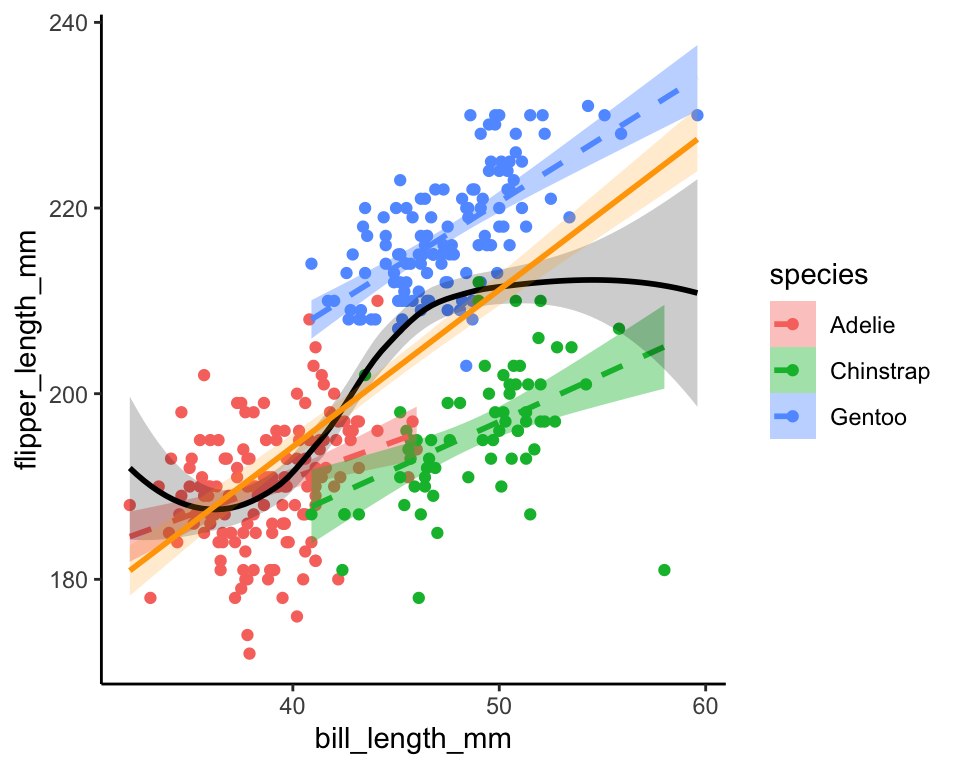
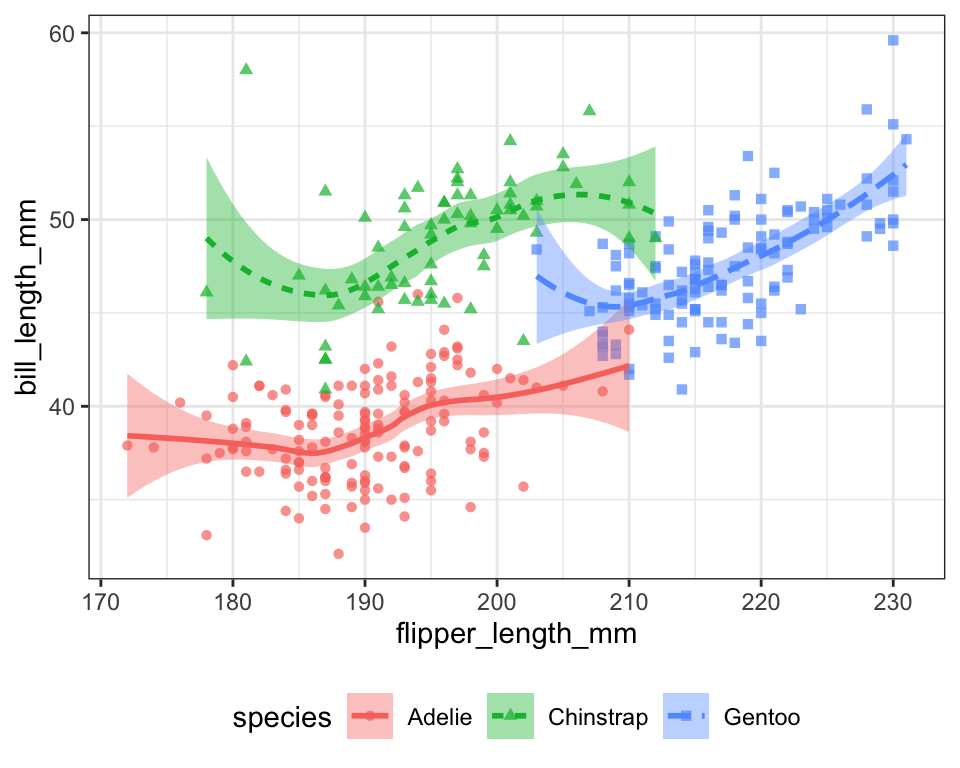
# Smoother 6
ggplot(penguins) +
  aes(x = flipper_length_mm,
      y = bill_length_mm,
      color = species,
      fill = species,
      shape = species,
      linetype = species) +
  geom_point(alpha = .7) +
  geom_smooth() +
  theme_bw() +
  theme(legend.position = "bottom")
#> `geom_smooth()` using method = 'loess' and formula 'y ~ x'
#> Warning: Removed 2 rows containing non-finite values (stat_smooth).

#> Warning: Removed 2 rows containing missing values (geom_point).