Part 13 The Grammar of Graphics
You can think of the grammar of graphics as a systematic approach for describing the components of a graph. It breaks down “classic” plots into individual components that let us make more complex, nuanced, and informative graphic through novel combinations.
The grammar of graphics has seven components (the ones in bold are required explicitly ggplot2):
- Data
- The data that you’re feeding into a plot.
- Aesthetic mappings
- How are variables (columns) from your data connect to a visual dimension?
- Horizontal (x) positioning, vertical (y) positioning, size, color, shape, etc.
- These visual dimensions are called “aesthetics”
- Geometric objects
- What are the objects that are actually drawn on the plot?
- A point, a line, a bar, a histogram, a density, etc.
- Scales
- How is a variable mapped to its aesthetic?
- Will it be mapped linearly? On a log scale? Something else?
- This includes things like the color scale
- e.g., c(control, treatment_1, treatment_2) -> c(“blue”, “green”, “red”)
- Statistical transformations
- Whether and how the data are combined/transformed before being plotted
- e.g., in a bar chart, data are transformed into their frequencies; in a box-plot, data are transformed to a five-number summary.
- Coordinate system
- This is a specification of how the position aesthetics (x and y) are depicted on the plot. For example, rectangular/Cartesian, or polar coordinates.
- Facet
- This is a specification of data variables that partition the data into smaller “sub plots”, or panels.
13.1 Example: Scatterplot grammar
For example, consider the following plot from the gapminder data set.
For now, don’t focus on the code, just the graph itself.
ggplot(gapminder) +
  aes(x = gdpPercap, y = lifeExp) +
  geom_point(alpha = 0.1) +
  scale_x_continuous(
    name = "GDP per capita",
    trans = "log10",
    labels = scales::dollar_format()
  ) +
  theme_bw() +
  scale_y_continuous("Life expectancy")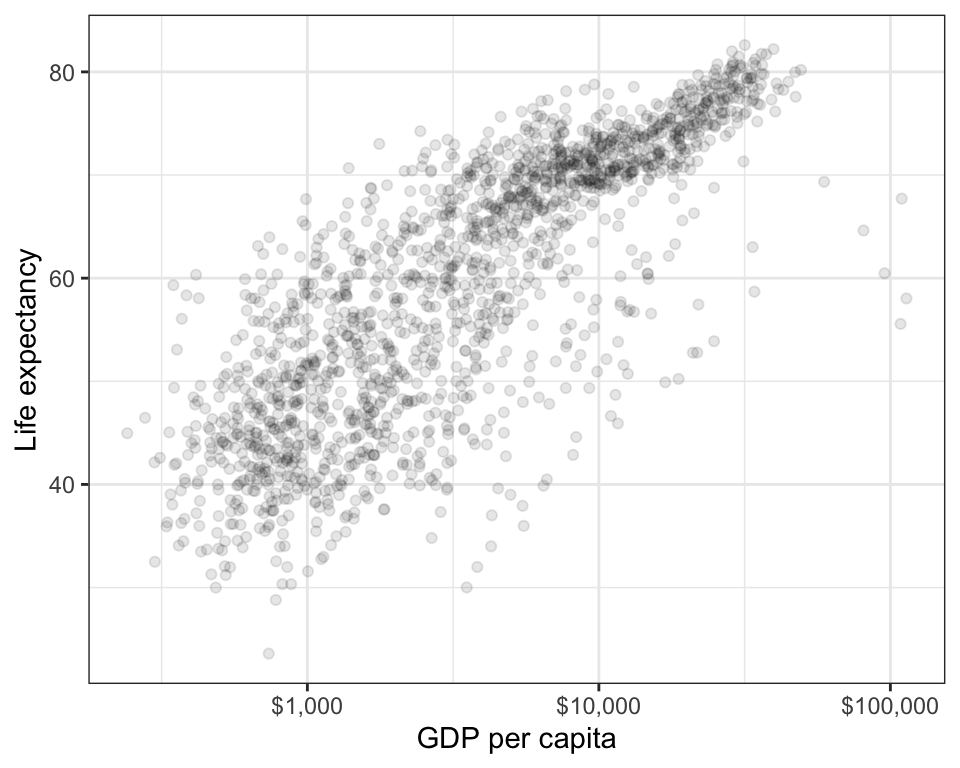
This scatterplot has the following components of the grammar of graphics.
| Grammar Component | Specification |
|---|---|
| data | gapminder |
| aesthetic mapping | x: gdpPercap, y: lifeExp |
| geometric object | points |
| scale | x: log10, y: linear |
| statistical transform | none |
| coordinate system | rectangular |
| faceting | none |
Note that x and y aesthetics are required for scatterplots (or “point” geometric objects).
Each geometric object has its own required set of aesthetics.
13.2 Activity: Bar chart grammar
Consider the following plot. Don’t concern yourself with the code at this point.
gapminder |>
  filter(year == 2007) |>
  mutate(continent = fct_infreq(continent)) |>
  ggplot() +
  aes(x = continent, fill = continent) +
  geom_bar() +
  guides(fill = "none") +
  theme_bw()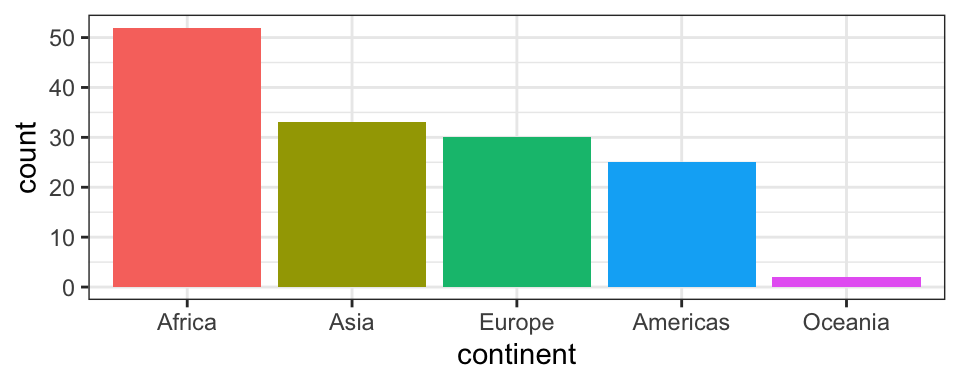
Fill in the seven grammar components for this plot.
| Grammar Component | Specification |
|---|---|
| data | gapminder |
| aesthetic mapping | FILL_THIS_IN |
| geometric object | FILL_THIS_IN |
| scale | FILL_THIS_IN |
| statistical transform | FILL_THIS_IN |
| coordinate system | FILL_THIS_IN |
| faceting | FILL_THIS_IN |