Part 12 Plotting in R
TL;DR: We’re using ggplot2 in progdata.
R has several frameworks for building graphics. One of the earliest advantages when R (and its predecessor S) were introduced in the 1980s was its professional plotting capabilities.
However, the “base R” plotting methods, mostly accessed using the plot() function, can be involved, and requires a lot of “drawing by hand”.
That said, for simple “quick looks” at data, base R plots can be useful:
plot(airquality[,1:4])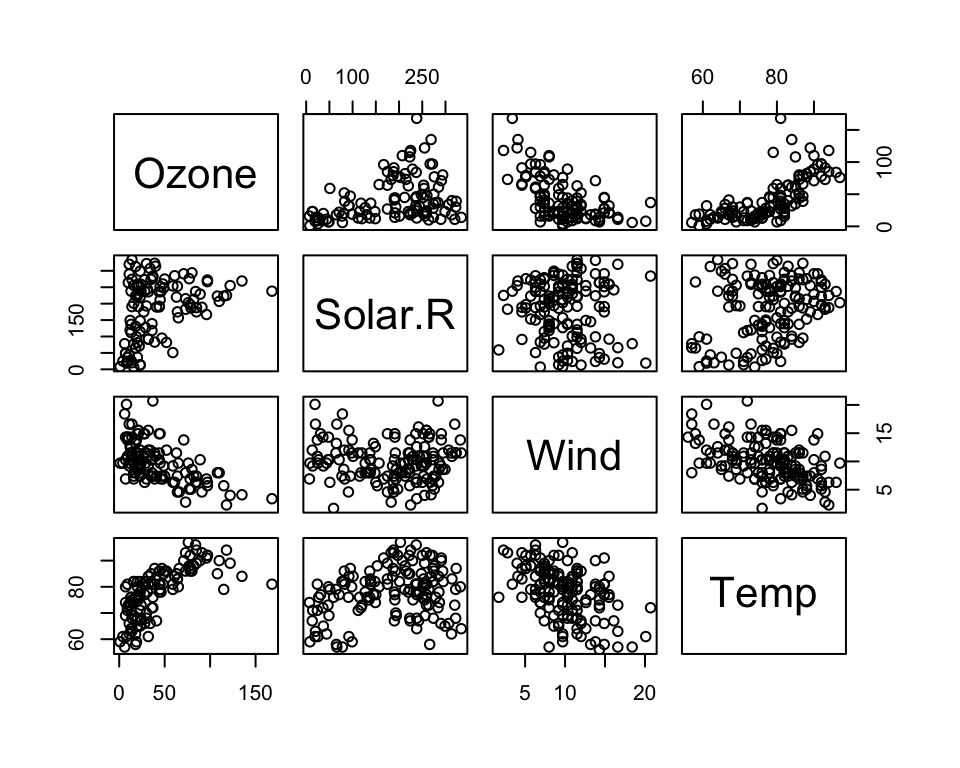
The most widely used modern plotting tool in R is ggplot2, which provides a very powerful framework for making plots. It has a theoretical underpinning, too, based on the Grammar of Graphics, first described by Leland Wilkinson in his “Grammar of Graphics” book. With ggplot2, you can make a great many type of plots with minimal code. It’s been a hit in and outside of the R community.
- A big advantage of ggplot2 is that many people have written extensions for it, such as ggdist (for plotting distributions and intervals), gganimate (for animations and GIFs), plotly for interactive graphs, and see (ready-built visualizations for many models).
12.1 Just Plot It
The human visual cortex is a powerful thing. If you’re wanting to point someone’s attention to a bunch of numbers, you probably won’t get any “aha” moments by displaying a large table like this, either in a report or (especially!) a presentation.
Make a plot to communicate your message!
Florence Nightingale was a pioneer in many fields (e.g., nursing, sanitation, public health, statistics). Her contributions to statistics (a field generally prohibited to women in her era) were centered around communicating data using visualization.
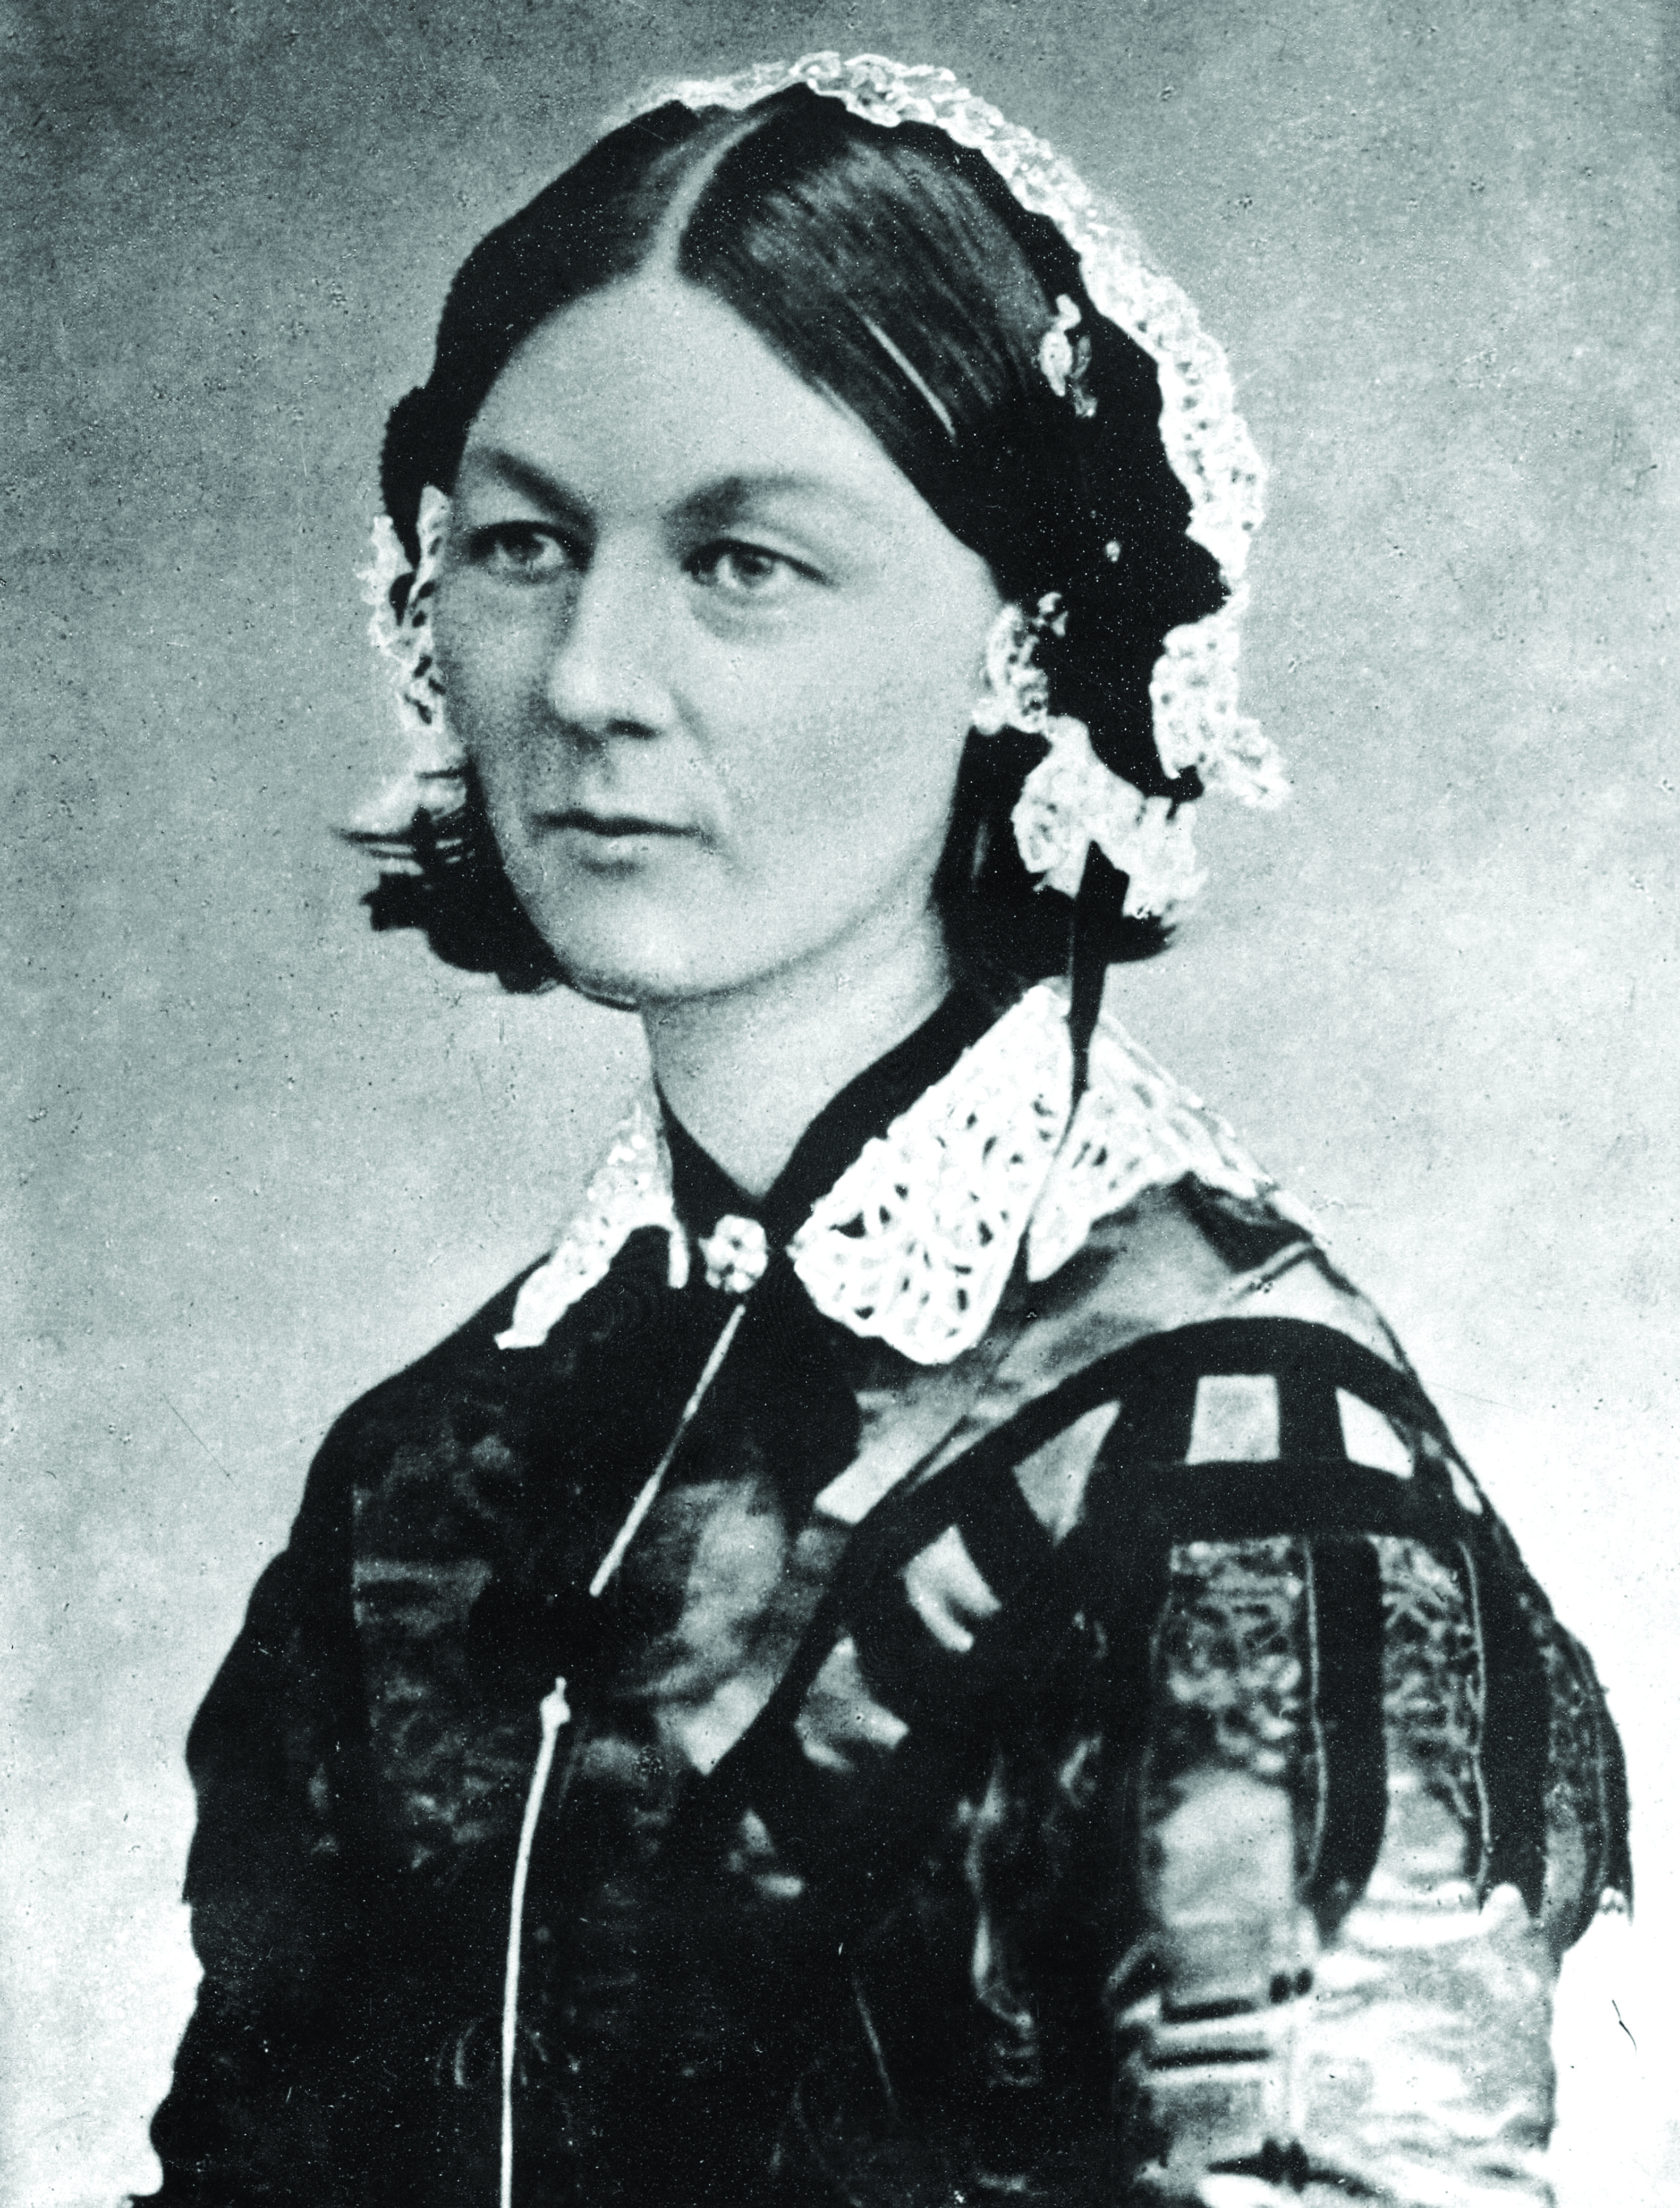
Picture of Florence Nightingale
During the Crimean Wars, she convinced the British military to implement a variety of sanitation measures through effective and innovative data visualization.
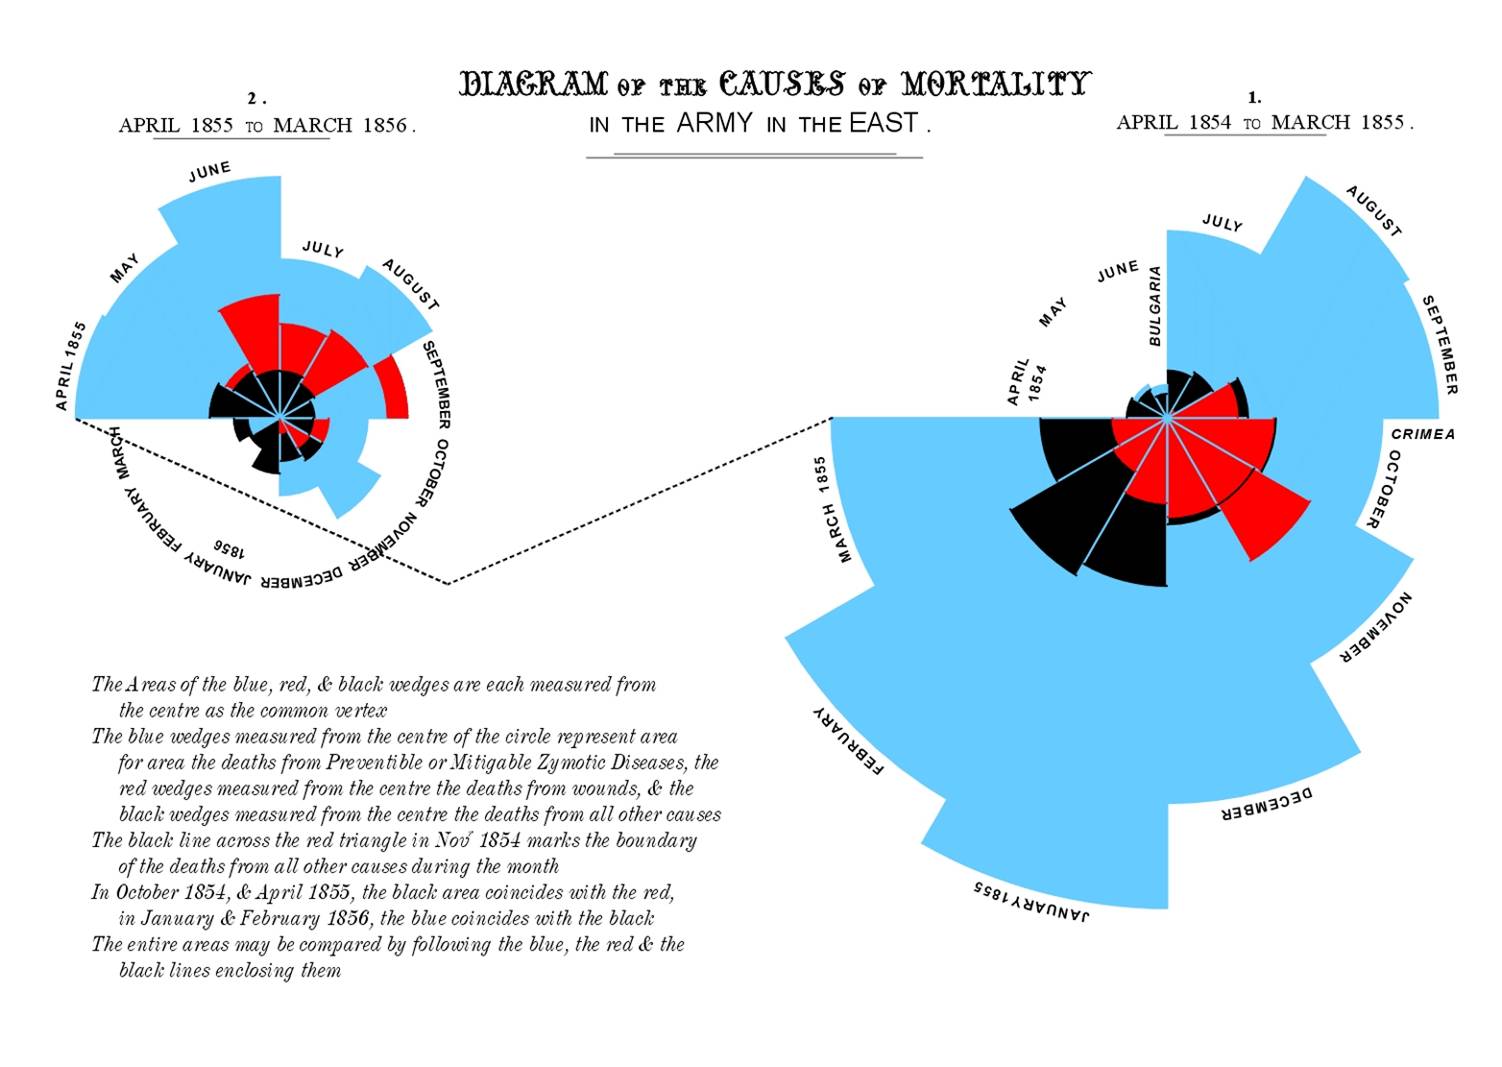
Florence Nightingale’s Rose Diagram
If you really feel the need to tell your audience every number exactly, consider putting your table in an appendix. Because chances are, the reader doesn’t care about the exact numeric values. Or, perhaps you just want to point out one or a few numbers, in which case you can put that number directly on a plot.